
Statistics
Statistics
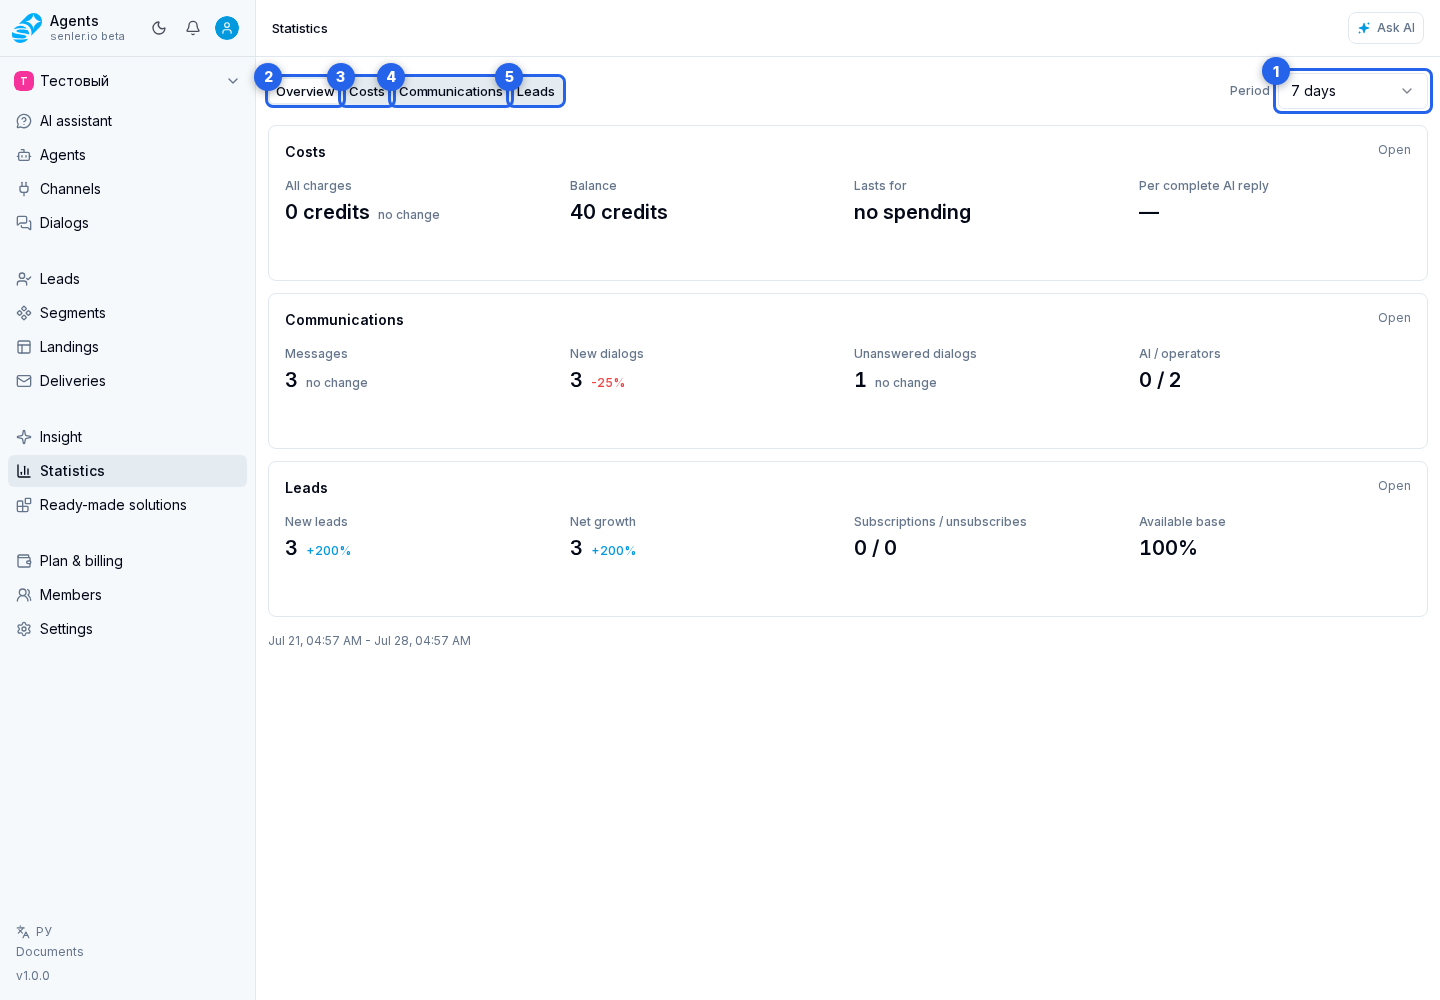
Open Statistics in the project side menu or the Statistics card in the project overview.
The statistics page shows project numbers for the selected period: credits used, messages, new and active dialogs, new leads, operator handoffs, and dialogs without an operator reply.
Difference From Insight
Statistics answers "what happened in the project": credit and token spend, messages, dialogs, hourly activity, channels, agents, leads, subscriptions, and unsubscriptions. It is an operational picture with numbers, charts, and comparison with the previous period.
Insight and the AI summary help explain what to do with the numbers: where metrics look problematic, which agents require attention, and which trends, anomalies, and possible causes exist. If you need to check spend, load, lead dynamics, or channels, start with "Statistics". If you need to understand agent quality and metric meaning, open "Insight".
Main elements
- period filter;
- tabs: overview, costs, communications, leads;
- key metric cards;
- credit spend chart;
- total spend on AI responses and dialogs;
- usage table for models, recognition, material creation, analytics, and tools;
- message and dialog charts;
- new lead, subscription, and unsubscription charts;
- lead subscription and unsubscription event log;
- messages by type chart;
- credit balance forecast;
- activity by weekday and hour;
- support schedule view;
- channels table;
- agents table.
Tabs
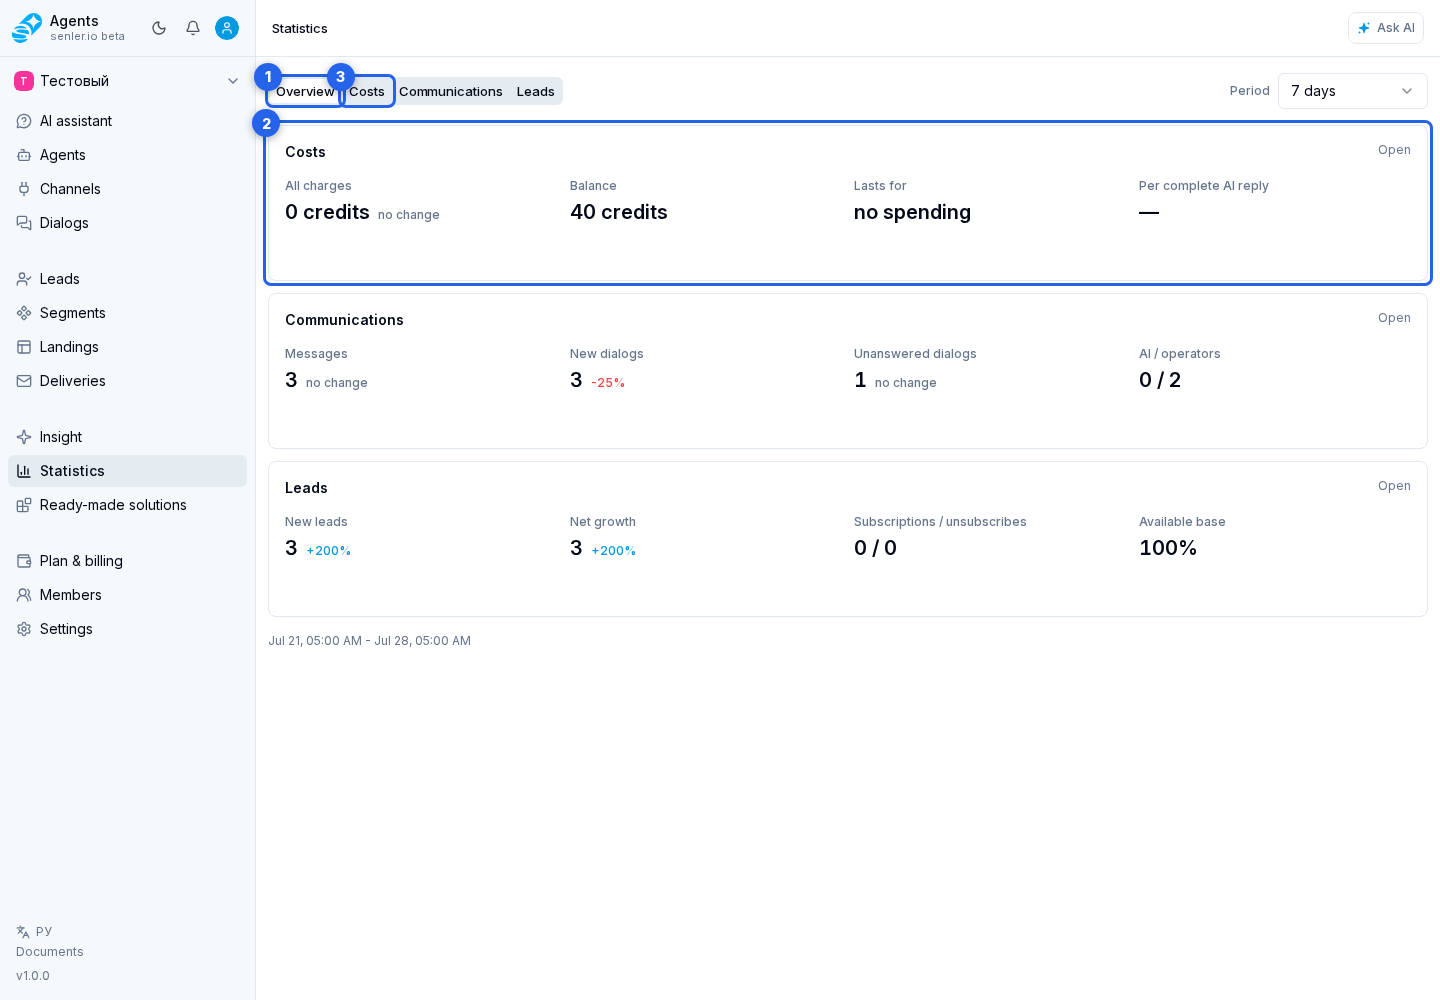
The Overview tab collects a short summary of costs, communications, and leads. From it you can open the detailed tab.
The Costs tab shows a credit and token summary, average spend per message and dialog, balance forecast, cost chart, breakdowns by channels and agents, and the full cost of AI responses by operation and tool.
The Communications tab shows a message and dialog summary, dialogs without replies, operator assignments, closed dialogs, average first response time, charts, the activity heatmap by weekday and hour, and the support schedule calendar.
The Leads tab shows new and active leads, subscriptions, unsubscriptions, net growth, lead base size, subscribed base, available base percentage, segment membership changes, and a log of specific subscription/unsubscription events.
How To Read Changes
Cards show not only the value for the selected period, but also the change compared with the previous period of the same length. If the value did not change, the cabinet shows "no change". Use these changes as a quick signal: they help understand where costs, dialog activity, or lead dynamics grew.
Time charts and the event log are built in the user's browser time zone. A time zone hint is shown next to the period range and in chart tooltips.
Tooltips and Ask AI
On a metric card, the question mark opens a short explanation of what is counted and for which period. Hovering over the rest of the card shows the "Ask AI" action after a short delay, with the selected metric as context.
On a chart, the regular point-value tooltip still appears next to the pointer. The "Ask AI" action appears separately at the top edge of the chart and does not replace the point values. This lets you inspect exact data first and then ask about the overall chart dynamics.
Periods
- 24 hours;
- 7 days;
- 30 days;
- 90 days.
Credits
Credits are more important than tokens for financial project evaluation. Check:
- how many credits were used during the period;
- average daily credit spend;
- average credits per active dialog;
- average credits per message;
- forecast for how many days the current balance may last.
If you need to understand which specific events created the spend, open the credit history. Statistics shows the picture by period, channels, and agents, while credit history shows spend operation details by agents, models, tokens, and events.
Average credit values may be fractional: for example average daily spend or average spend per active dialog. The balance forecast is shown in days at the current spend rate and may be empty if there were no credit charges during the selected period.
AI response costs
The AI responses block on the Costs tab shows the full response cycle cost, not only text generation by the model. It includes related operations: model usage, image and speech recognition, image and audio creation, analytics, and tool calls.
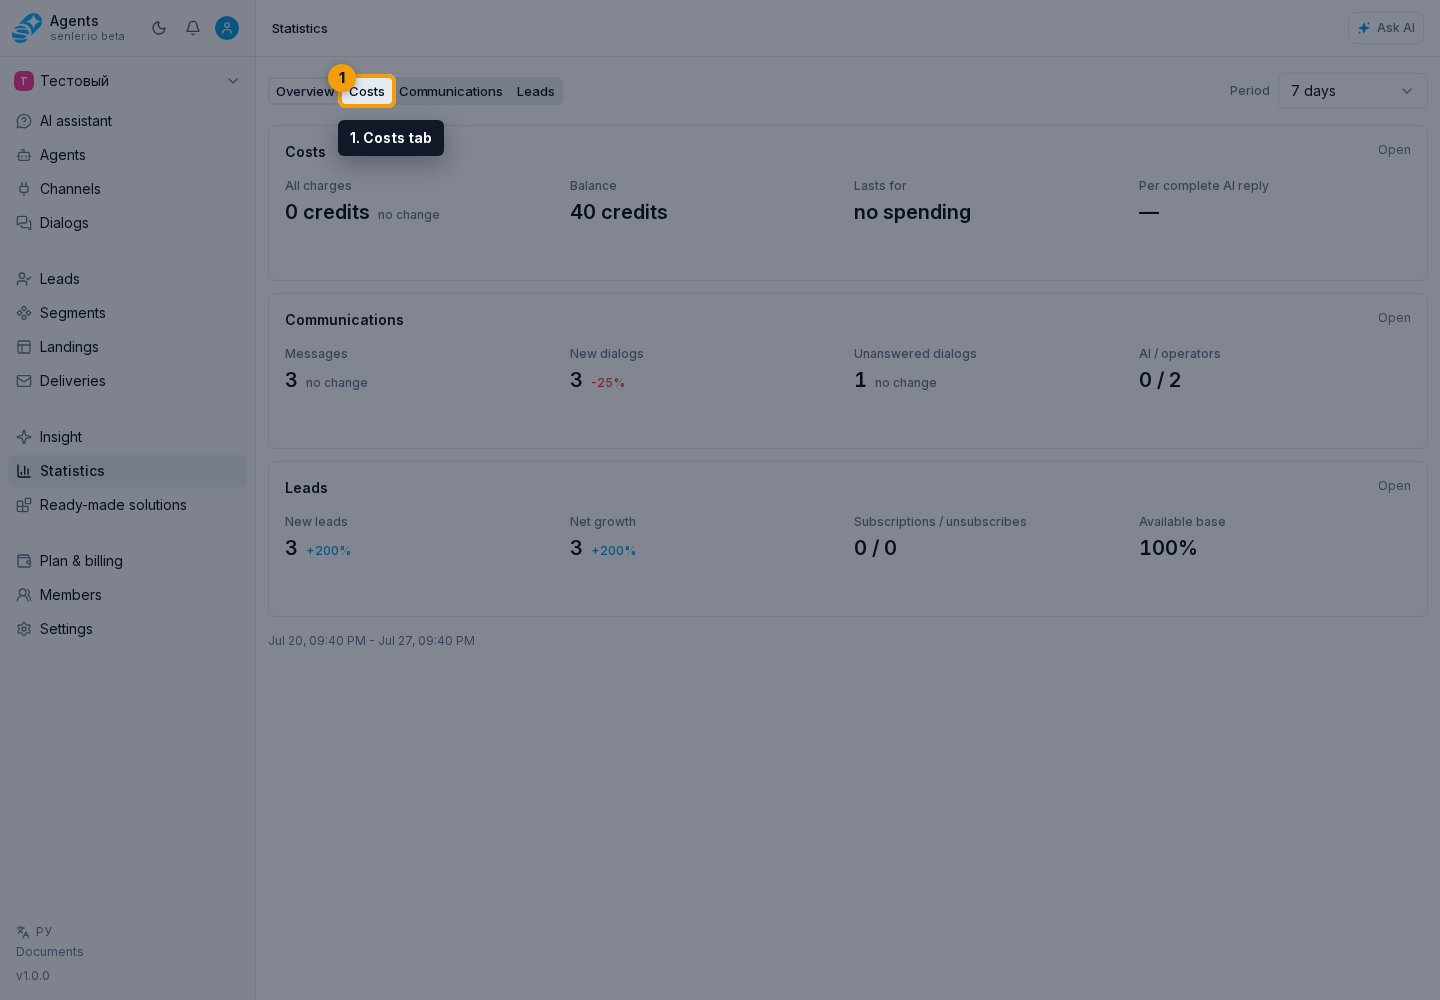
The summary shows:
- total spend in credits and its monetary equivalent;
- the number of AI responses and dialogs with such responses;
- average spend per AI response;
- average spend per dialog.
An AI response is counted after the assistant message is saved. This does not confirm delivery to an external channel. New data normally appears after a short delay; older events are processed later when a backlog exists.
The “Usage and costs” table explains where credits were spent. Operations are grouped by purpose: agent response, recognition, material creation, analytics, and tools. Agent response separates input, cached, and output tokens. Tools are grouped by purpose, such as material creation, interface and delivery, automation, recognition, data and knowledge, and internet and integrations, and are not added to the total twice.
Columns show operation, volume, spend, and share of total spend. When volume has several measurements, open the value to view details. Tool rows also show call and error counts.
The monetary equivalent uses the currency and rate that applied when the operation occurred. If operations used different currencies or part of the data has no matching rate, credits still count toward the total while the monetary amount may be incomplete. While older data is being prepared, the block shows an update state and refreshes automatically.
Communications and leads
Statistics uses leads, not "active people". The section shows:
- new dialogs;
- active dialogs;
- new leads;
- active leads;
- lead subscriptions;
- lead unsubscriptions;
- lead net growth;
- closed dialogs;
- dialogs without an operator reply;
- operator handoffs;
- average time to first response.
Operator replies
The Support operators block shows each operator's first and total reply counts, average first and regular reply time, median, P90, and maximum waiting time. Schedule-adjusted time and full calendar time without the schedule are shown side by side for comparison.
The per-operator breakdown includes a member's reply when that member was marked as a support operator at the time it was sent. If a regular member replies without this flag, the wait in the dialog ends, but that reply is not attributed to them in the operator table. Turning off the flag later or removing the member does not change statistics already collected for past replies.
Reply time is fixed after the reply is sent. A later schedule change does not recalculate metrics already stored for a past period.
Support schedule in statistics
On the "Communications" tab, the support schedule can be viewed as a calendar or a compact table; the cabinet remembers the selected view in this browser. The calendar shows operators and working intervals by day. The compact table shows operators in rows, dates in columns, and totals for shifts and hours; it can be printed, downloaded, or copied as an image. The back arrow and forward arrow switch months. This helps compare response time with actual working intervals.
If "Use schedule in response statistics" is enabled in settings, first and average response are calculated only inside support working intervals. Overlapping assignments form one shared working interval and do not multiply time. If the schedule is disabled, response statistics are calculated without limiting by working time.
Schedule editing is located in "Settings" -> "Support": there you create shifts, assign operators to dates, and configure interval end on the next day.
Subscription and unsubscription log
The "Leads" tab has a subscription and unsubscription event log for the selected period. It loads additional pages as you scroll.
An event row may show:
- lead name, username, or lead ID;
- external user ID on the platform;
- subscription or unsubscription source, when provided by the platform;
- event type: subscription or unsubscription;
- event time with a time zone tooltip.
Use the log when the chart shows a spike in subscriptions or unsubscriptions and you need to understand which leads and sources created it.
Segment subscriptions
On the Leads tab, the Segment subscriptions table shows joins, leaves, and net change for each segment during the selected period. A positive change means more leads joined than left; a negative change means more leads left the segment.
An agent subscription segment has a separate agent icon. Select it to view the agent's name and state or open its settings. Its values are calculated in the same way as an ordinary segment. When a segment has been deleted, a Deleted label remains next to its name so historical data stays understandable.
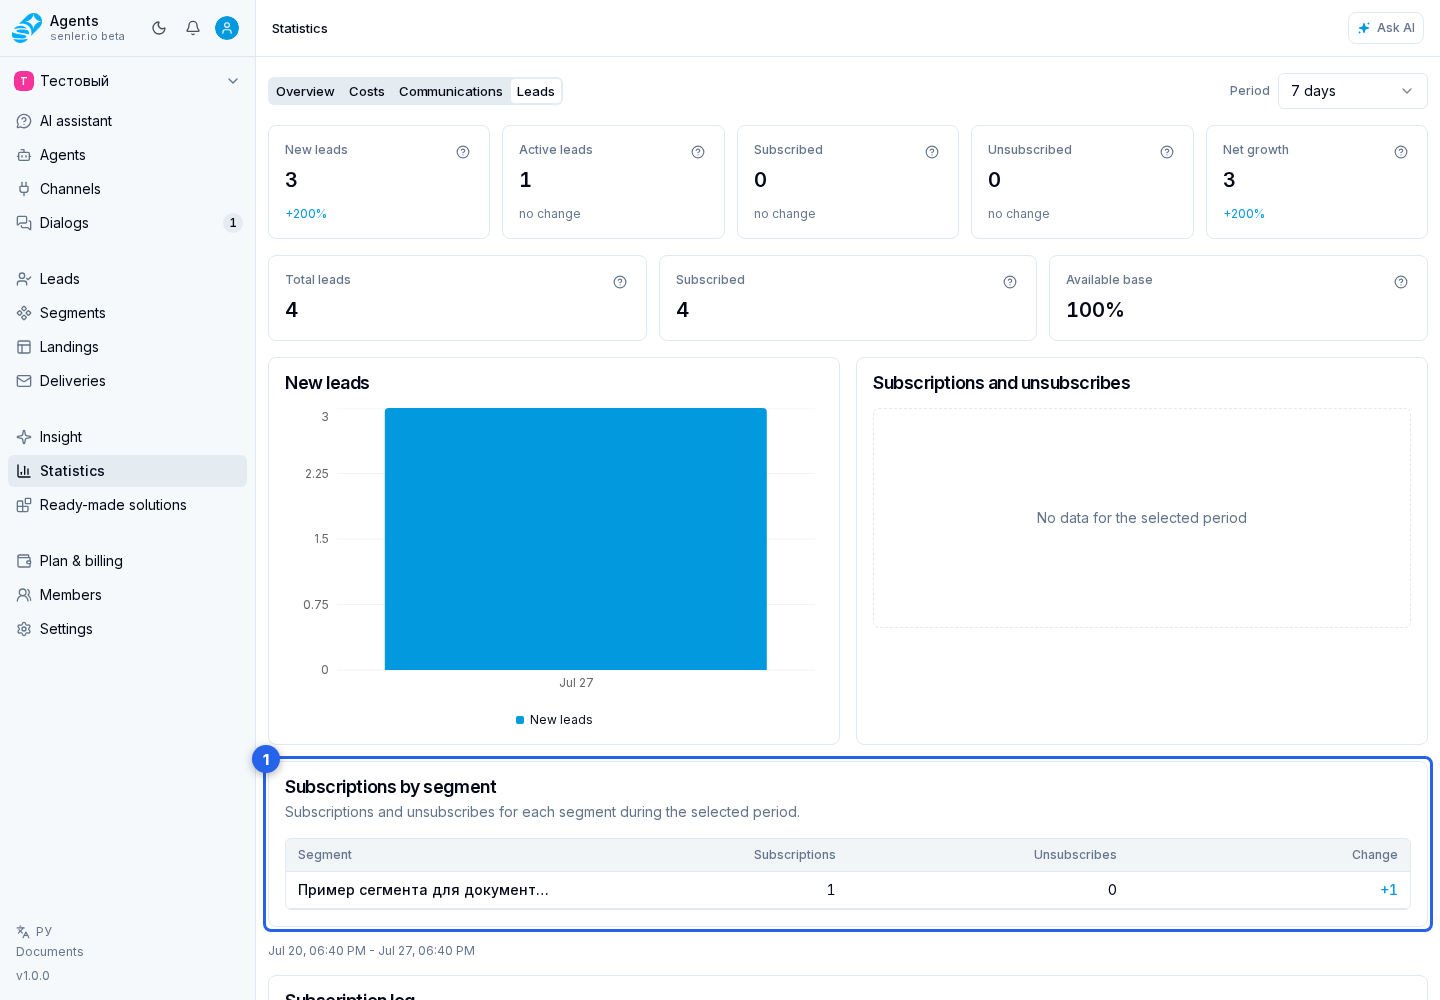
This table answers which segments are growing or shrinking. To inspect specific leads and why they entered a segment, open that segment or a lead card: the general subscription log below describes permission to receive messages, not segment membership.
If statistics is empty
- check the selected period;
- check whether the project had messages and dialogs;
- check whether channels are connected;
- check that the user has access to project analytics.