
Insight
In the side menu, open Insight. This opens the main Insight page. Insight shows how agents and conversations are performing based on metrics.
Difference From Statistics
Insight and the AI summary are for interpreting quality: they show problematic metrics, agents that require attention, trends, anomalies, metric extraction history, and explanations of changes.
Statistics is for the project's numeric operational picture: credit and token spend, the full cost of AI responses and related tools, messages, dialogs, leads, subscriptions and unsubscriptions, time-based activity, channels, and agents. If the question is "how many", "what made up the spend", "where did costs grow", or "how did the lead base change", use Statistics. If the question is "why is this metric bad" or "which agent needs attention", use Insight.
How to start an analysis
Start with the AI summary for a quick view of important changes and topics in the selected period. For a detailed analysis, set the conditions you need in the filters, then use the evaluation mode tabs to choose what you want to examine: anomalies, trends, normatives, or history.
Begin the investigation with problem metrics, which show the indicators that need attention. Next, check the agents requiring attention to see where the problems are concentrated and the automations requiring attention to find problematic parts of published workflows. To verify the individual results behind a metric, open the metric history.
Filters
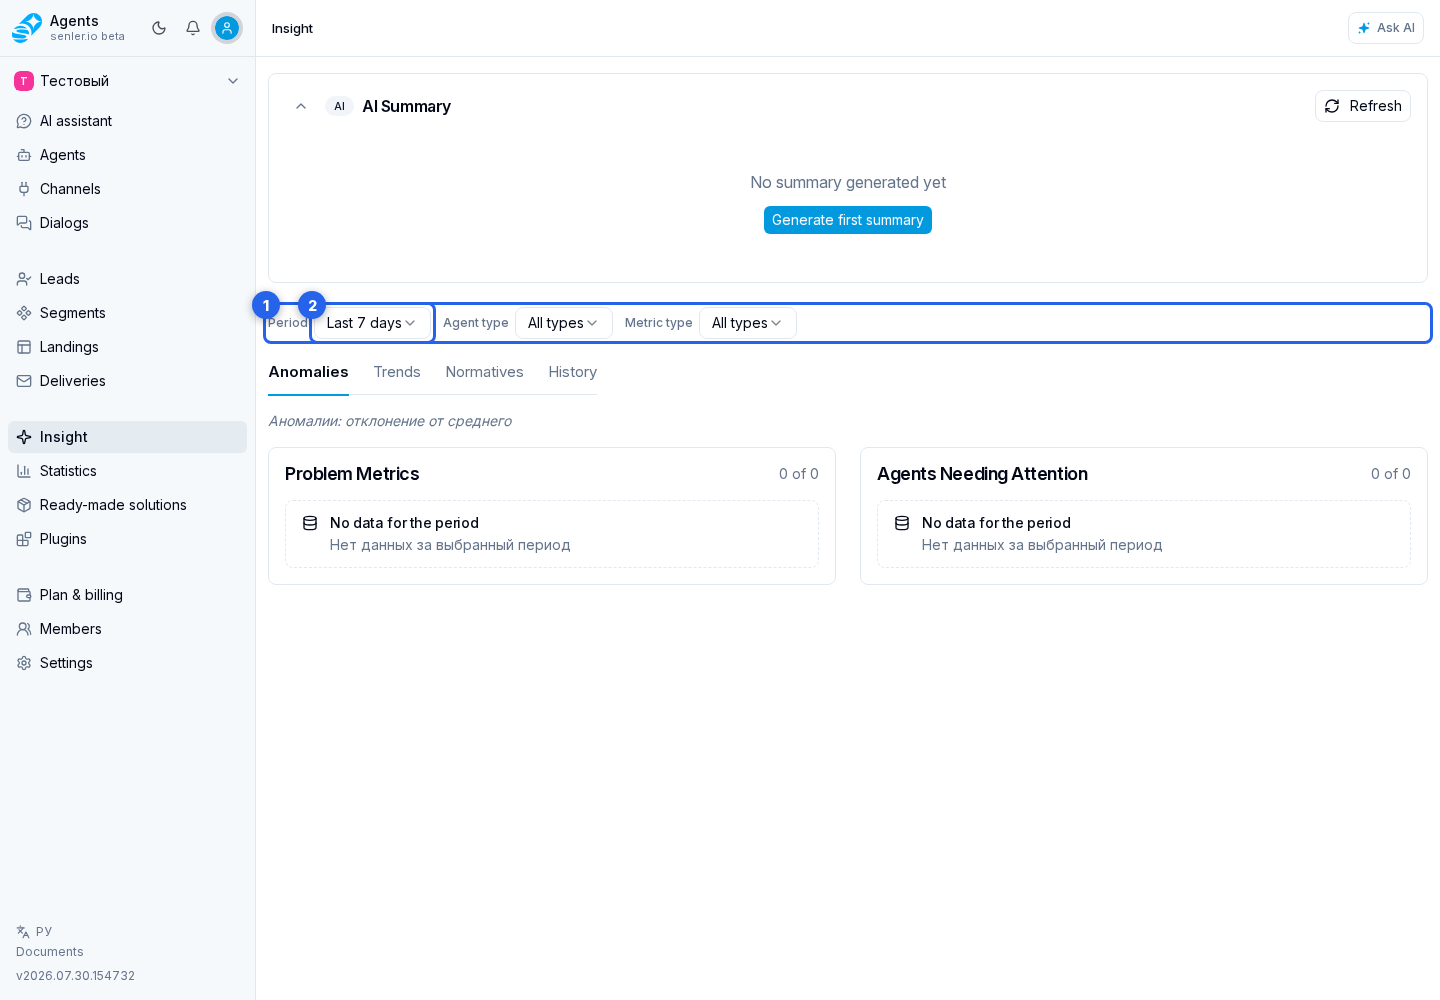
- Use the filter panel to keep only the data you need.
- In Period, select the last 24 hours, 7 days, 30 days, or all time.
- In Agent type, keep all types or select Sales, Support, Notifications, Assistant, Education, Surveys, or General.
- In Metric type, keep all metrics or select built-in, agent-type, or custom metrics.
Which metrics are compared
Rankings, trends, and individual metric pages can use both event metrics and additional discussion attributes that have a meaningful good and problematic direction. For example, urgency and issue severity are compared across agents and periods together with other indicators.
A primary discussion category is not included in this comparison: it groups topics in the AI summary. Use the summary for the topic list and the Insight tabs for changes in evaluative attributes.
The count shown next to a metric is the number of its observations, not necessarily the number of unique dialogs. For an event metric, these are message evaluation results; for an additional discussion attribute, they are detected topic fragments. One dialog can contain several observations.
Tabs
Choose a tab based on the question you want to answer:
- Anomalies — which agents or metrics stand out from the rest;
- Trends — what changed compared with the previous period;
- Normatives — which values moved away from their targets;
- History — which individual results formed the indicators.
Problem metrics
- the problem metrics block shows where a value is bad or requires attention;
- displays the number of problematic ones relative to the total;
- selecting one opens the detailed metric page.
Agents requiring attention
- the block shows agents with problematic performance;
- selecting one opens the Insight page for that agent.
- on the agent page, select the agent name or avatar to open the agent settings. This navigation is available to users who can edit agents.
Automations requiring attention
This block uses the latest AI summary results and checks published automations against accumulated metric observations. Its counter shows how many automations have detected issues relative to the total number of published automations included in the check.
Each automation recommendation includes the automation name, priority, detected issues, and proposed workflow changes. Select Open workflow to open the editor. If the recommendation refers to a specific step, the editor opens and selects that step.
When there are no recommendations, the block explains why: the check found no issues, there are not enough observations yet, there are no published automations, or the data could not be retrieved temporarily. To run the check again, refresh the AI summary.
If Insight is empty
- check whether the agent’s metrics collection is enabled;
- check whether the agent version with metrics is published;
- check whether there were dialogs in the selected period;
- check the filters;
- check that the metrics are included in the analytics;
- check the history of metrics extraction.