
Automations in Statistics
The Automations tab helps you understand whether the project keeps up with lead actions. It shows step execution speed and waits caused by the plan limit across all project automations.
Step Execution
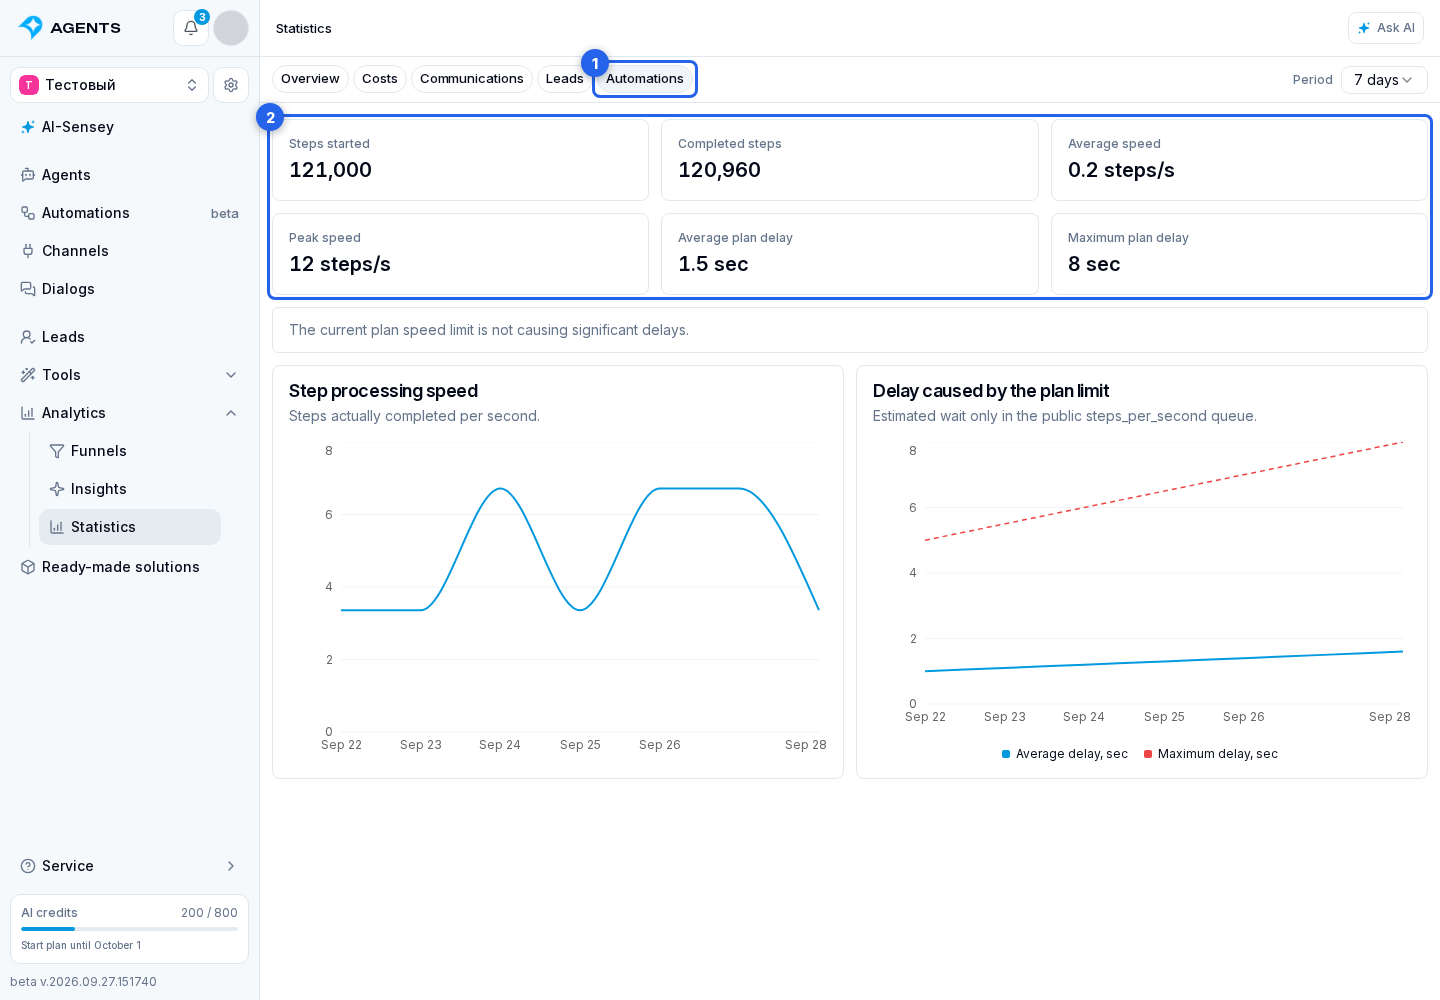
Open the Automations tab and select a period.
The summary contains metric cards for:
- Steps started and Steps completed: work during the period. These are steps, not runs of an entire automation.
- Average speed: steps completed per second, averaged across the selected period.
- Peak speed: the highest recorded step start rate.
- Average plan delay and Maximum plan delay: estimated waiting caused by the speed limit. The average uses steps with that delay.
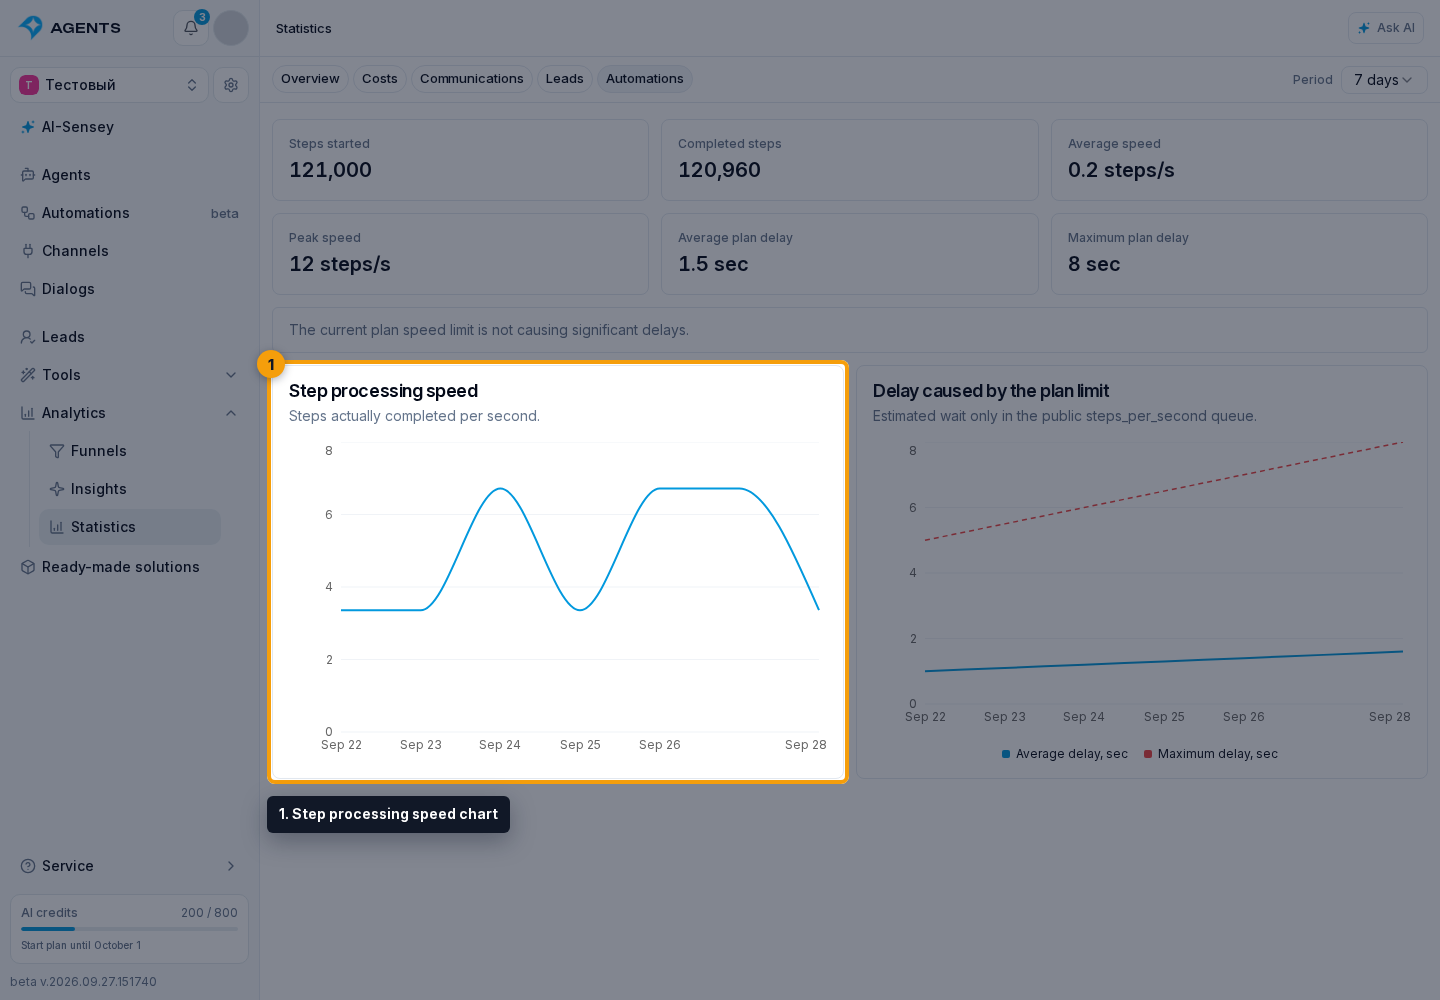
Processing Speed
The Step processing speed chart shows actual completed steps per second. Use it to see when automations processed more work.
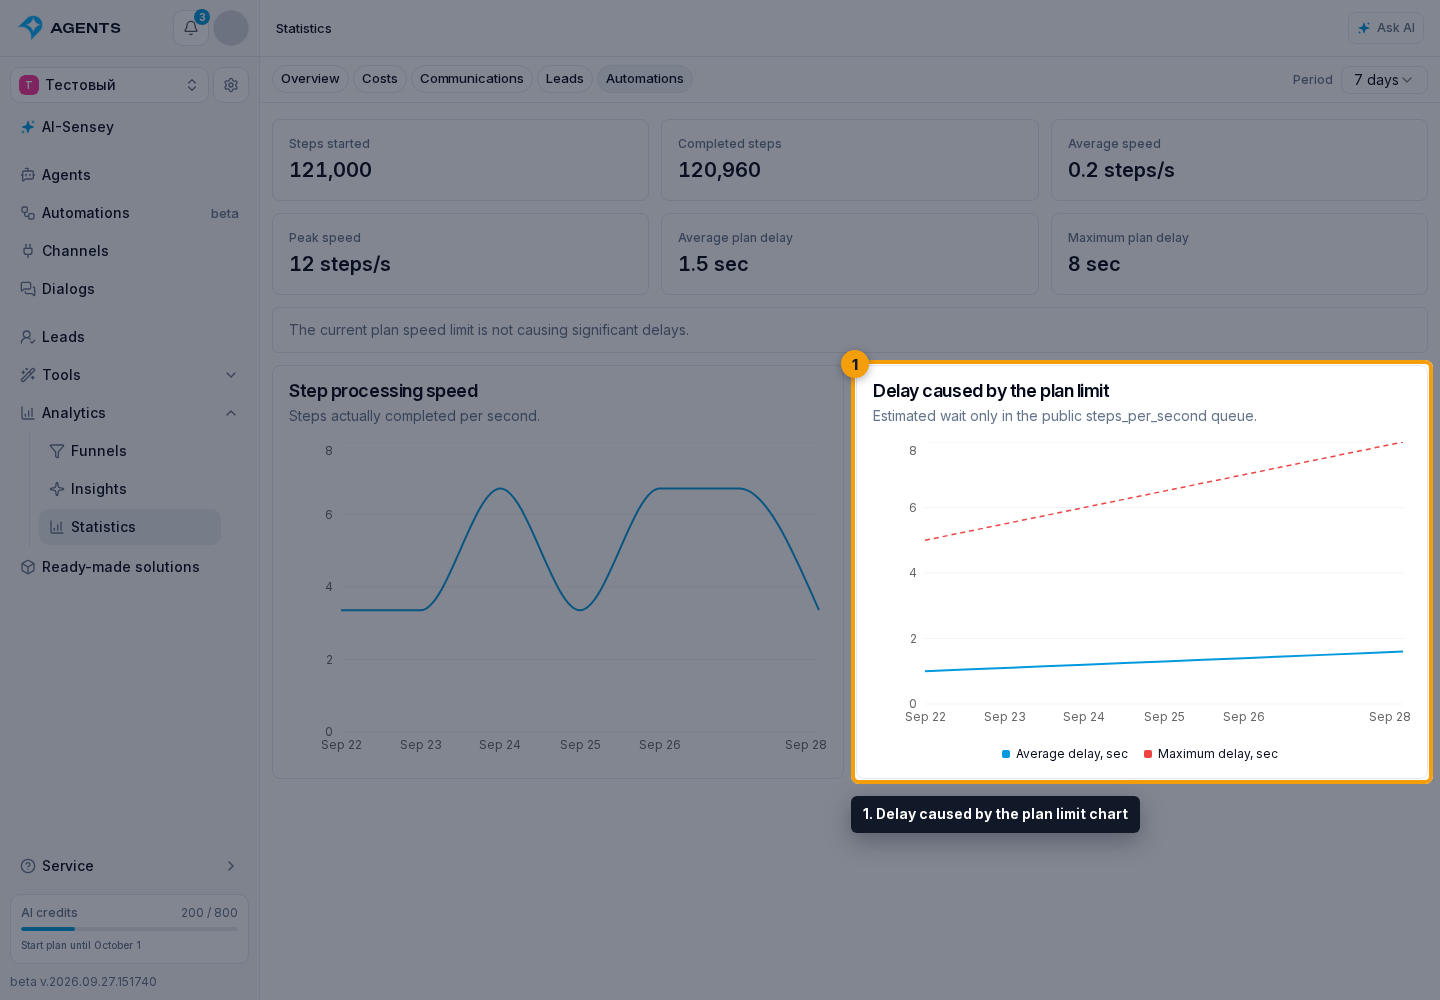
Plan Delay
The Delay caused by the plan limit chart shows average and maximum waiting caused by the steps-per-second limit. This is not total automation duration: waiting in a Pause step and time spent calling an external service have a different meaning.
Below the summary, an assessment states whether there are no significant delays, speed is insufficient, or there is not yet enough data. This assessment uses the last five completed minutes, not the entire selected period.
If the limit slows processing, review speed options and acceleration in Plan and payment. To investigate a specific scenario, open the automation.
When Data Appears
The first charts require two fully completed minutes of observations. The indicators describe executed steps; no data for a period does not mean automations are not configured.