
Statistics
Open Statistics in the project side menu or the Statistics card in the project overview. The statistics page collects the project's numeric indicators.
Where to start
- In the period filter, select the last 24 hours, 7 days, 30 days, or 90 days.
The period applies to every tab. Cards compare the selected interval with the preceding interval of the same length, while dates in charts and logs use the browser's time zone.
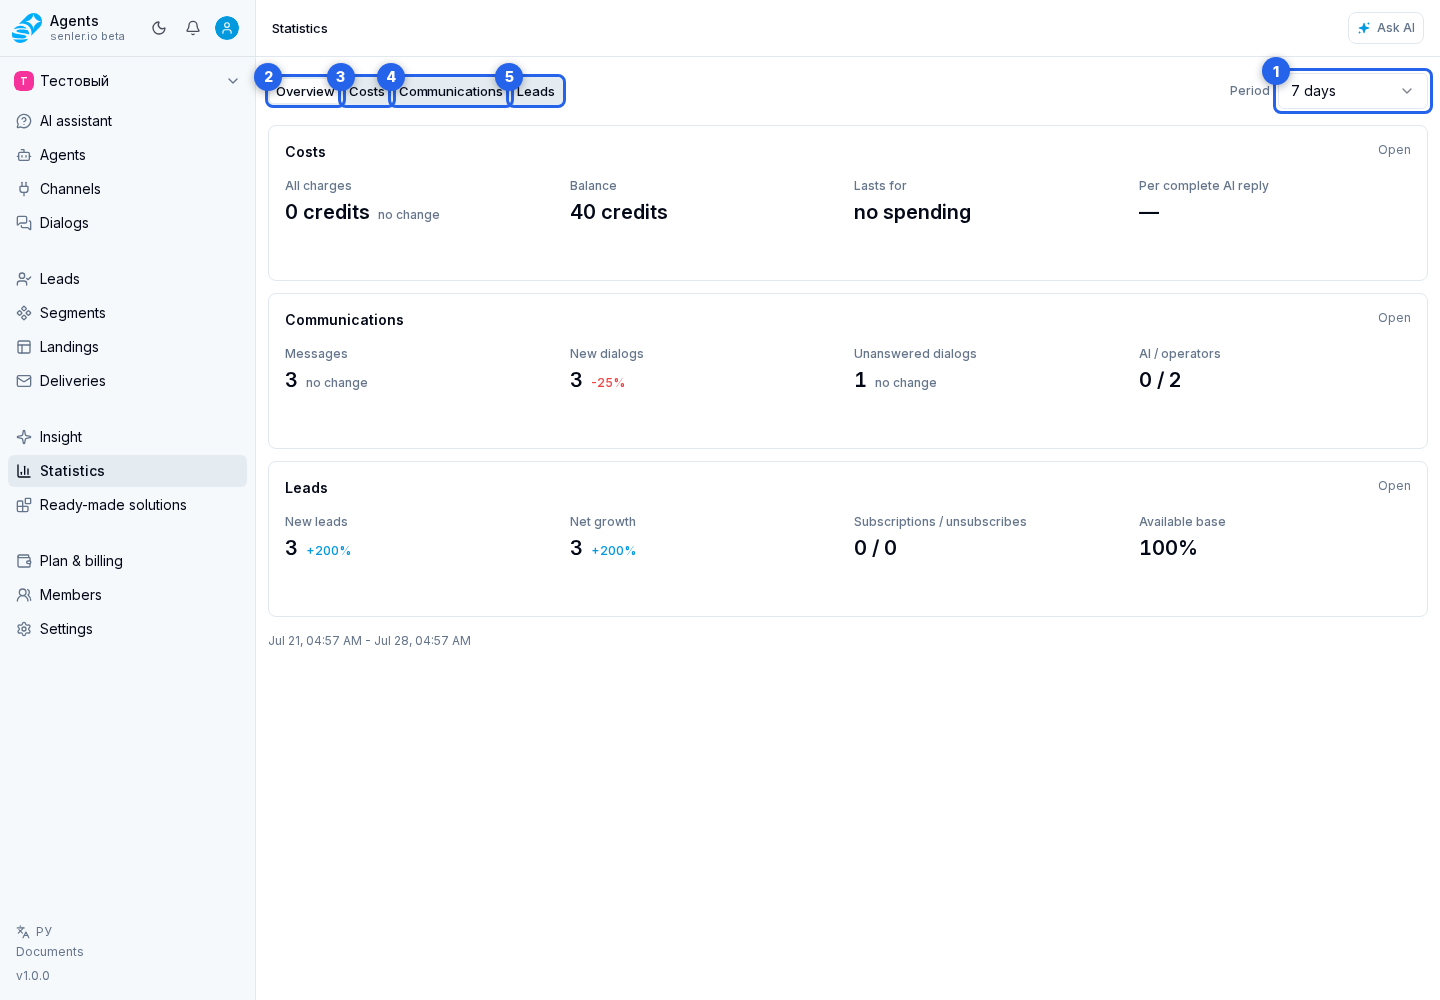
Which section to open
- Overview — quickly review costs, communications, and leads on one screen;
- Costs — understand how many credits were spent and on which operations;
- Communications — check messages, dialogs, workload, and operator response speed;
- Leads — review lead inflow, subscriptions, unsubscriptions, and segment changes.
- Automations — check step processing speed and the delay caused by the current plan's limit.
How To Check Automation Speed
Open the Automations tab. The automation summary shows how many steps started and completed, average and peak processing speed, and the average and maximum plan delay for the selected period.
The Step processing speed chart shows the number of steps actually completed per second. The Delay caused by the plan limit chart shows the estimated wait in the queue whose speed is limited by the plan. It plots average and maximum delay separately.
The assessment below the cards indicates whether the current speed is sufficient, is limiting execution, or does not yet have enough data. The first assessment requires two fully completed minutes of observations.
How to read cards and charts
A metric card shows the change from the previous period next to the current value. The percentage sign indicates the direction of change, but not always its quality: for example, more messages may be useful, while longer response time is not.
Use charts to find the date or time of a noticeable change. Point to a data point, bar, or cell to see its exact value.
Tooltips and Ask AI
The question mark on a card explains what is counted. Pointing to a card or the upper part of a chart reveals the Ask AI action with the selected indicator's context. It can help analyze the dynamics but does not change project data or settings.
Difference from Insight
Statistics answers “what happened”: how many credits were spent, how many messages, dialogs, and leads appeared, when the workload increased, and how subscriptions changed.
Insight helps assess performance quality: which metrics look problematic, which agents need attention, and what stands out in anomalies, trends, or normative deviations.
If there is no data
- check the selected period;
- make sure the project had messages, dialogs, or lead events;
- check that channels are connected;
- make sure the user has access to project analytics.