
Funnel statistics
Open a funnel to view current counts or passages during a selected period.
Metrics
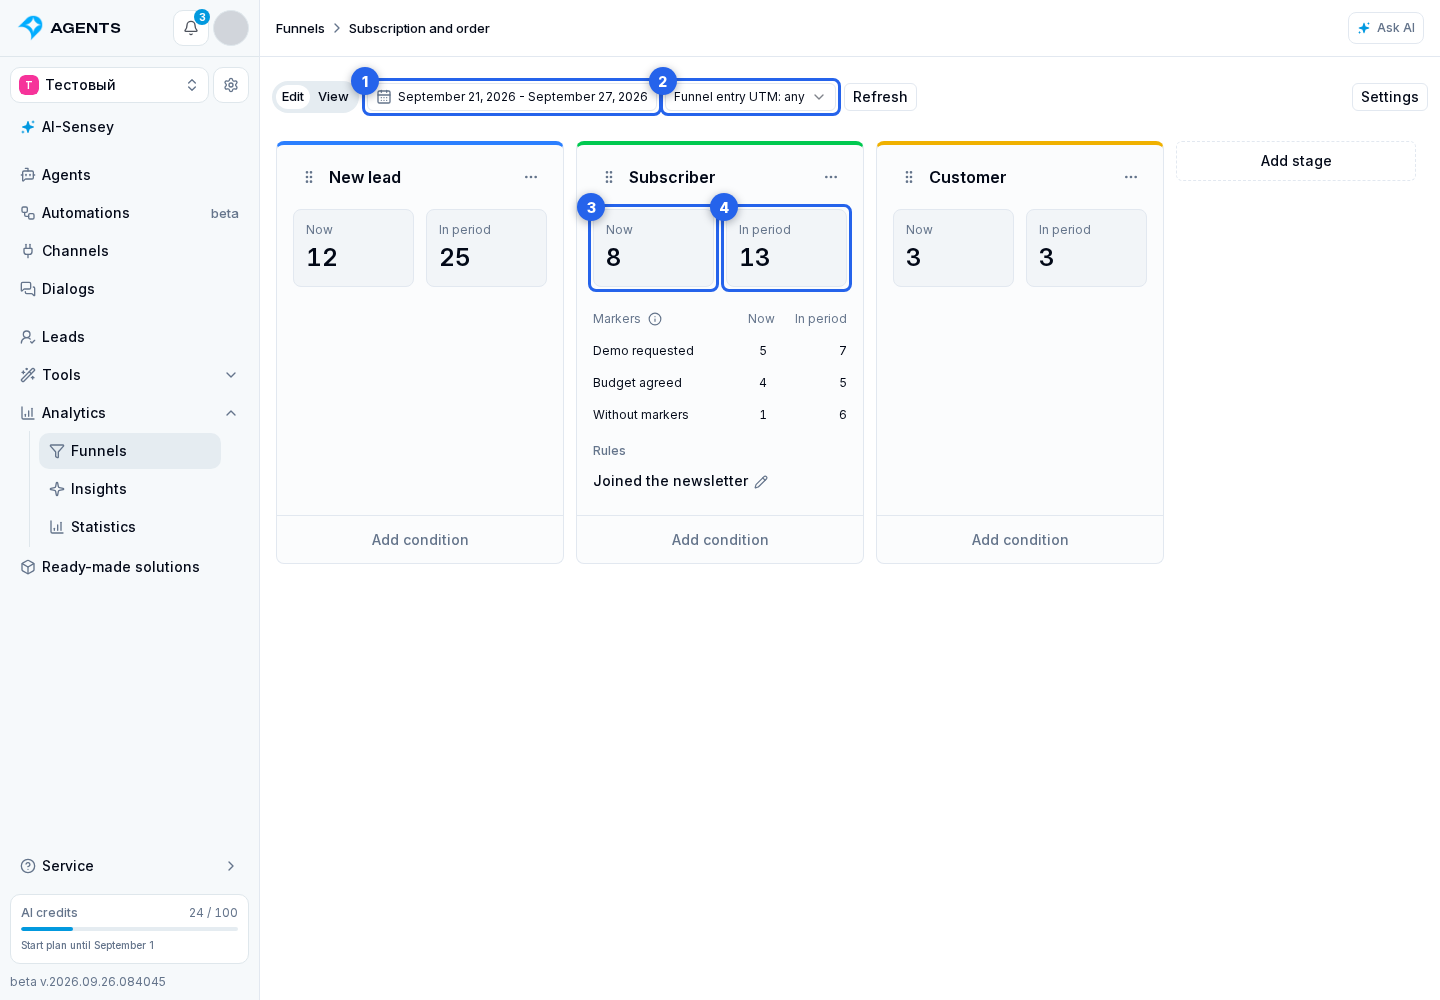
Each stage has two metrics. Edit shows both; View shows the one selected with the switch:
| Count | What it measures |
|---|---|
| Now | Leads currently at this stage. Selected dates do not affect this count. |
| In period | Entries during the selected dates, including repeat entries by the same lead. Redelivery of the same event does not increase the count. |
Period and UTM
- Select a passage period of up to 366 days.
- If needed, set the UTM filter.
Dates include entire days in the browser's time zone. The UTM filter applies to both counts using tags saved on funnel entry. Later changes to the lead's tags do not change that participation's history. Leaving and entering again saves new tags.
Counts refresh approximately every 15 seconds. You can also click “Refresh”; history may appear shortly after a transition.
In the “Edit” tab:
- Click the “Now” tile to find the stage's current leads.
- Click the “In period” tile to open transition history.
Members who can view leads can open lead lists and history. With analytics access alone, the counts are visible but do not open details. Read more about member access to funnels.
Funnel chart
- Switch to the “View” tab.
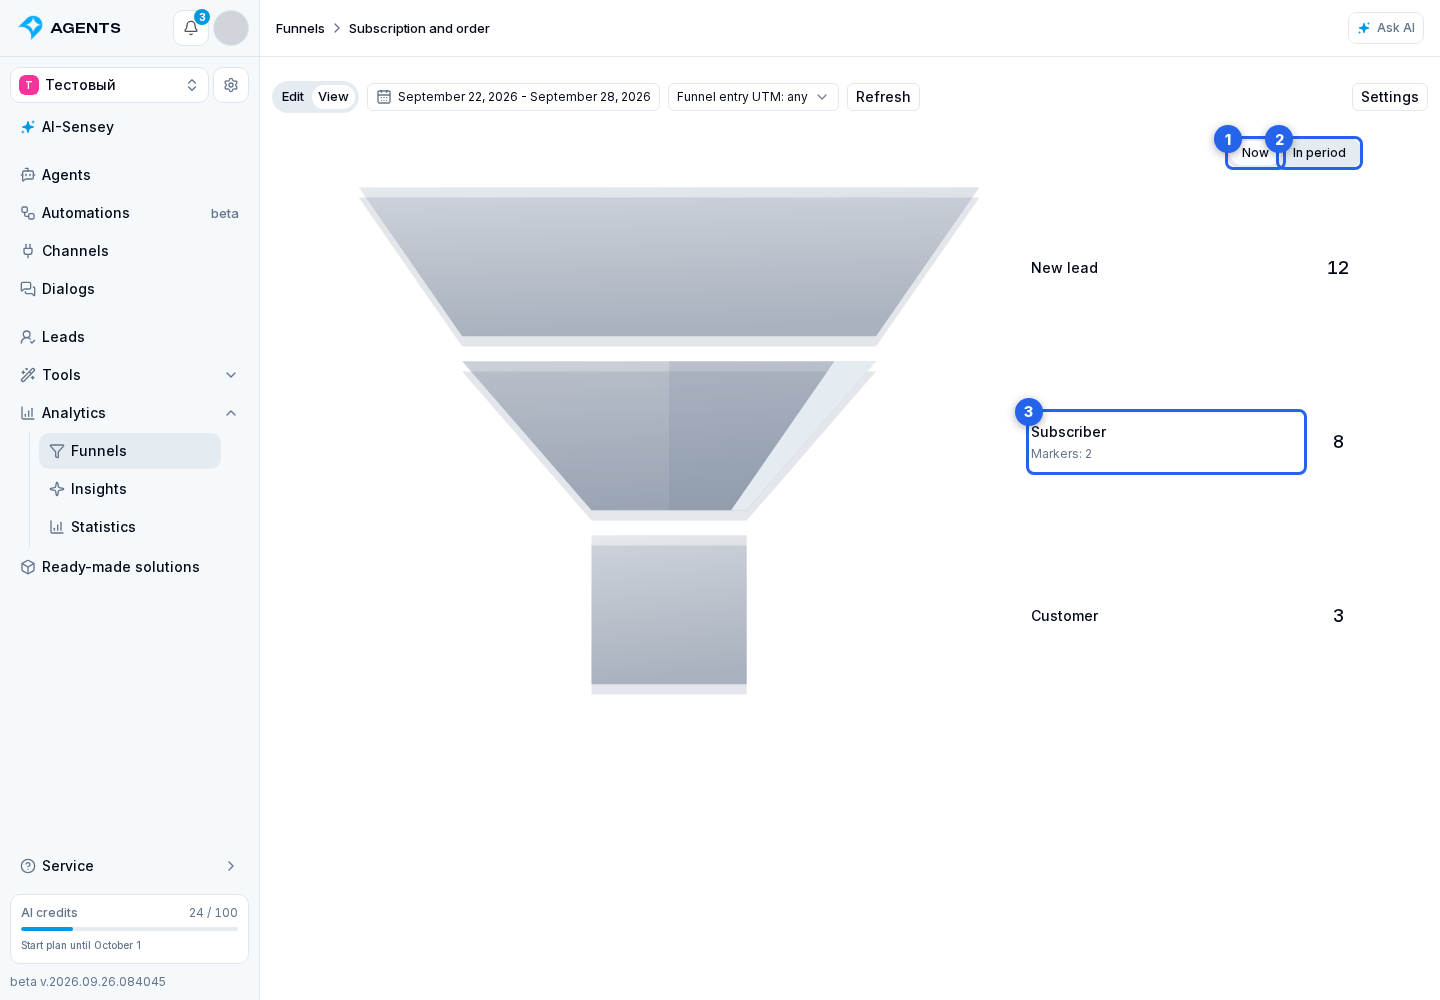
- Select a metric: “Now” or “In period”.
The selected metric determines stage widths and marker shares in the vertical funnel. The top edge of each stage is proportional to its value relative to the highest value in the funnel; the bottom edge connects to the next stage. When the count increases, the funnel widens. Zero is shown as a thin line. Names and the selected metric's count appear on the right.
Stages with markers show “Markers: N” below their name: the number of configured markers, not the number of leads. “Without markers” is excluded from this count.
Each marker occupies a separate section within its stage, including “Without markers”. Its size is its count for the selected metric divided by the sum of all marker counts and “Without markers”. A lead with multiple markers is counted in each, so this sum can exceed the number of leads. Stages without markers have no marker-count label, breakdown or marker table.
Click a stage name to see its markers.
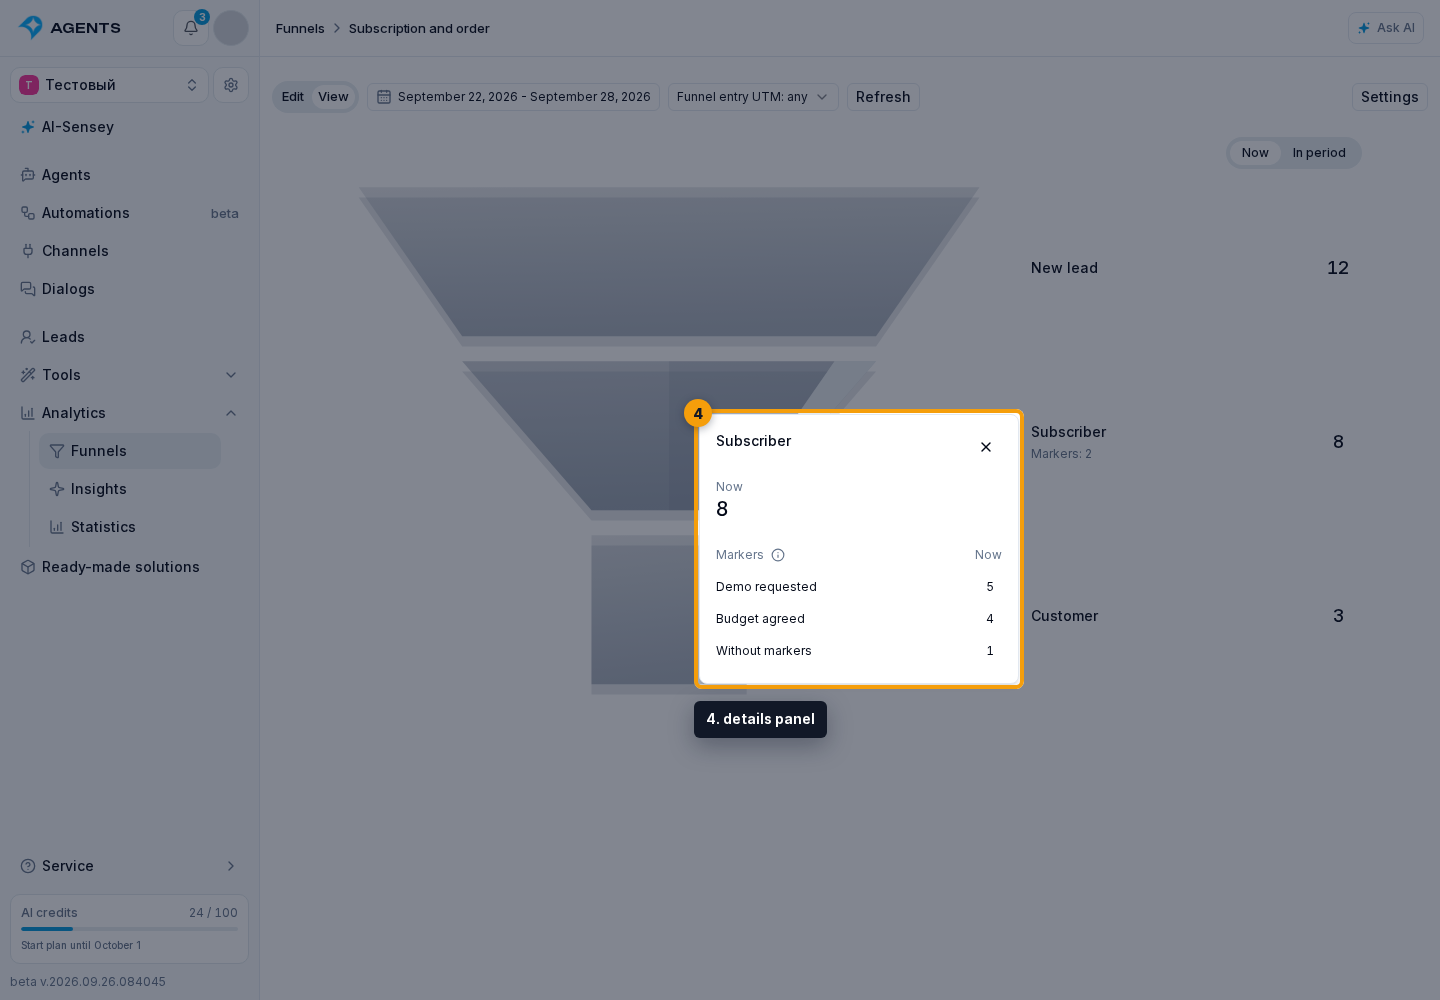
The details panel opens with a list of markers and their counts.
- Click a section of the stage in the chart to see one marker's details and share.
- Close the panel using the cross, Escape, or by clicking the same element again.
On a computer, details also appear on hover: to the right of the chart or to the left of the stage name in the legend. Clicking keeps the panel open.
To open leads from the counts:
- In “Now” mode, click the count to the right of a stage to open all its current leads.
- For an individual marker, click “Open current leads” in its details. Clicking its count in the stage's marker list opens the same selection.
- In “In period” mode, click the count to the right of a stage to open the stage entry history.
Marker counts in “In period” mode show how many distinct leads received each marker during the period. These are not lists of current leads.
Marker configuration and the differences between their counts are described in Stage markers.
If a count does not change
If passages do not change, check transition conditions, the lead’s position and stage order, the selected event, dates and UTM. Past events and rule edits do not create historical passages. If the issue remains after refreshing, send support the funnel name, lead and expected transition time.