
Metrics History
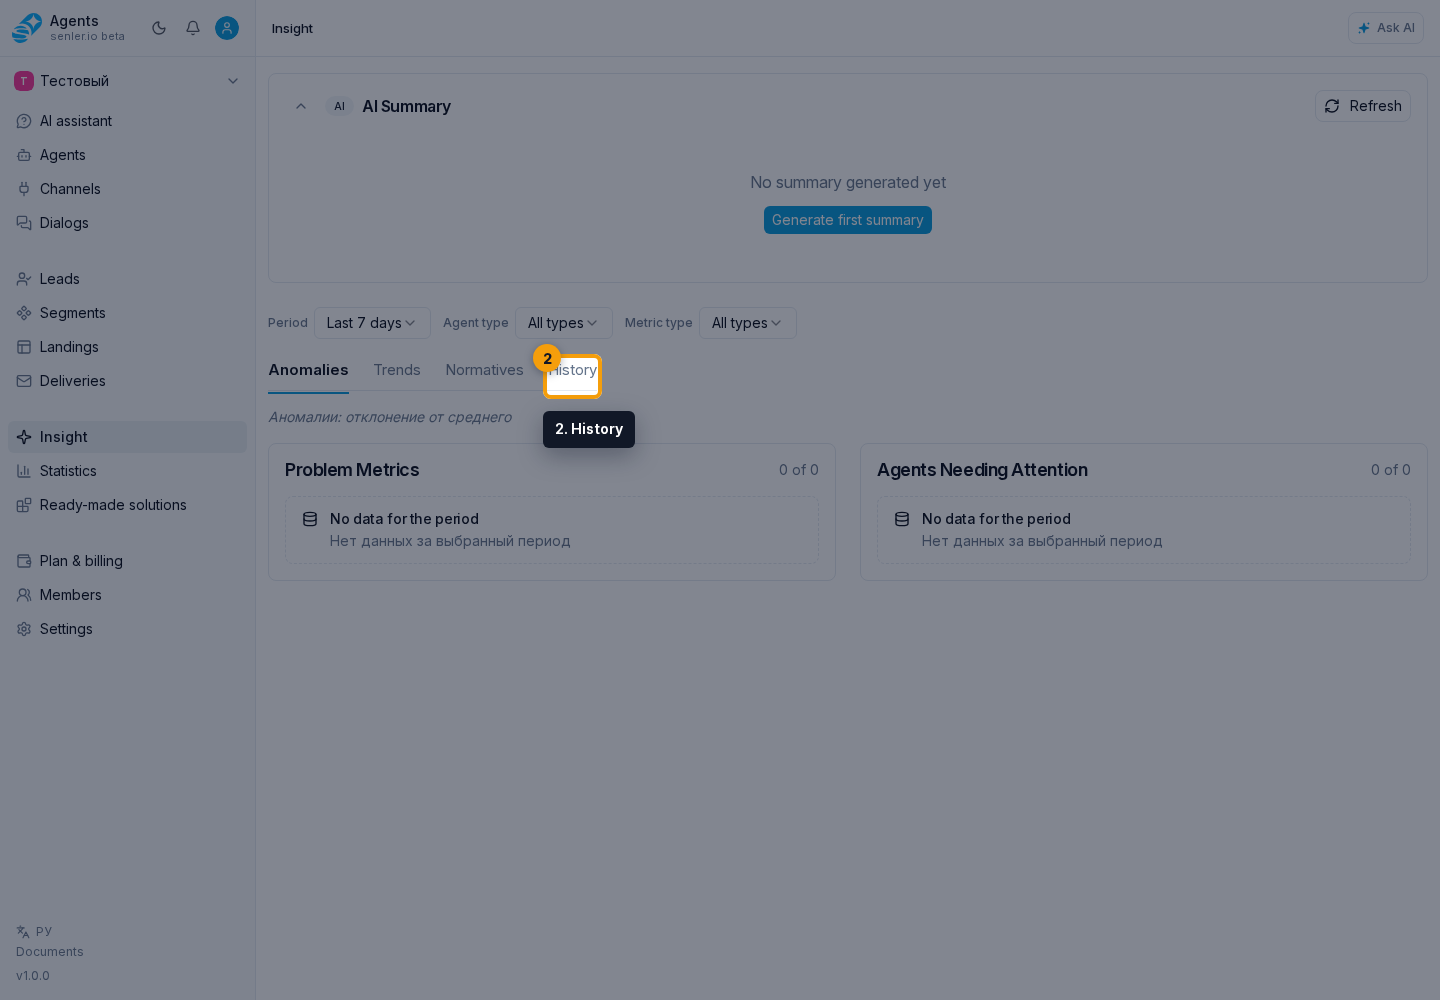
In the side menu, open Insight, then select the History tab on the Insight page. The history table shows extracted metric records and helps explain which records formed the indicators and why a specific value looks unusual.
When to open it
- a metric value changed sharply;
- you need to check a specific agent or dialog;
- the AI summary pointed to an anomaly;
- you need to compare time, value, and confidence score.
What the table shows
- search across records;
- sorting by time, numeric value, metric name, and confidence score;
- newest-to-oldest or oldest-to-newest order;
- pagination;
- totals for records, unique metrics, agents, and dialogs.
How to investigate an unusual metric
- Open metric history.
- Find a record by metric name, agent, or dialog.
- Check the value, time, and confidence score.
- Open the related dialog or event history.
- If the issue is in value extraction, adjust the AI metric instruction and check the result on new data.